Analysing Variability in Frontoparietal Activity in Children with and without ADHD
By Hu Ding Xuan
Published on June 15, 2025
June 15, 2025
Project definition
Background
Childhood ADHD is one of the most prevalent neurodevelopmental disorders worldwide. Hallmarks of ADHD include hyperactivity, impulsivity and deficits in sustaining attention and behavioural control. However, its diagnostic heterogeneity makes it difficult to pinpoint its neural basis. Thus, capturing moment-to-moment brain fluctuations through fMRI has the potential to shed light on the neurobiological basis of the variability and inconsistency of ADHD symptoms. For my project, the analysis of the frontoparietal network will be focused on the dorsolateral prefrontal cortex and right posterior parietal cortex. The dlPFC is important for implementing control strategies, while the right PPC is found to be associated with more severe inattention symptoms. Understanding connectivity differences in these regions can reveal neural mechanisms driving ADHD symptoms during inhibitory tasks.
Tools
The project relied on the following technologies:
- Jupyter Notebook
dataladfor downloading datasetsfmriprepfor preprocessingnilearnfor ROI masking, BOLD signal extraction, Pearson correlations, brain connectivity mapsmatplotlib&seabornfor plotting and visualiationscipyfor Welch’s t-tests
Data
- Dataset: OpenNeuro ds005899
- Used only sub-7565 and sub-8150 for single-subject comparison analysis due to time constraints
- CSST, 2 runs per subject (TR=0.49s)
Deliverables
- Jupyter notebook
- GitHub repository with a READme, directories
- Processed fMRI data
- Figures: time series plots, heatmaps, brainmaps
Results
Progress overview
- Extracted time-series from 2 ROIs (dlPFC & PPC) using
NiftiSpheresMaskerinnilearn - Computed 2x2 Pearson correlation matrix for right dlPFC and right PPC
- T-tests to examine group connectivity differences using
scipy - Generated whole-brain connectivity maps seeded from the right dlPFC
Tools I learned during this project
fmriprepfor preprocessing fMRI data- Correlation matrix construction
nilearnto visualise and analyse data
Results
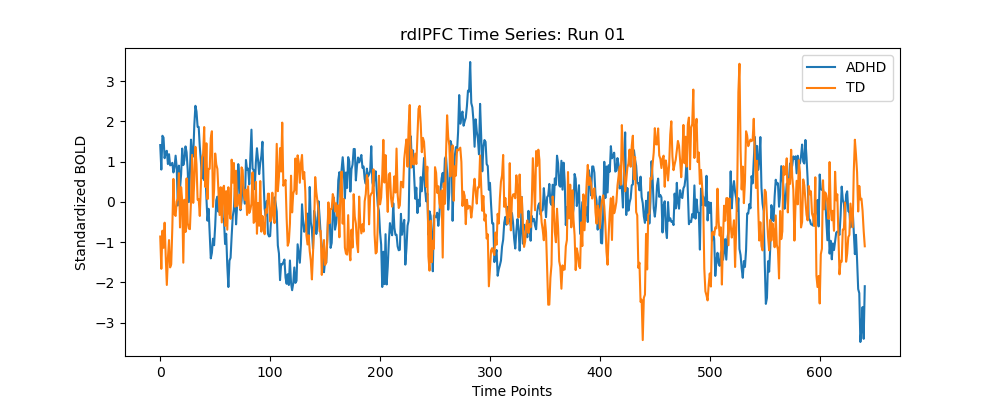
Deliverable 1: Time Series Plots
The right dlPFC time series analysis revealed no significant group differences.
Deliverable 2: Pearson Correlation Matrix
Results indicated a stronger correlation in ADHD subject 7565 of 0.69 compared to typically developing subject 8150 of 0.2.
Deliverable 3: Seed-based Connectivity Maps
Results in subject 7565 showed a strong positive correlation of 0.73 with the right PPC and negative correlations down to -0.73 in the left hemisphere. This may suggest enhanced frontoparietal activity and suppressed default mode activity.
Challenges and Limitations
- Long fMRI preprocessing time
- Lack of significant results likely stems from reduced statistical power (n=2)
- Beginner level proficiency in tools, struggled resolving coding errors
Future Directions
As my project now is mostly exploratory, moving forward, analysing the remaining subjects could further deepen insights into the ADHD neural mechanisms.