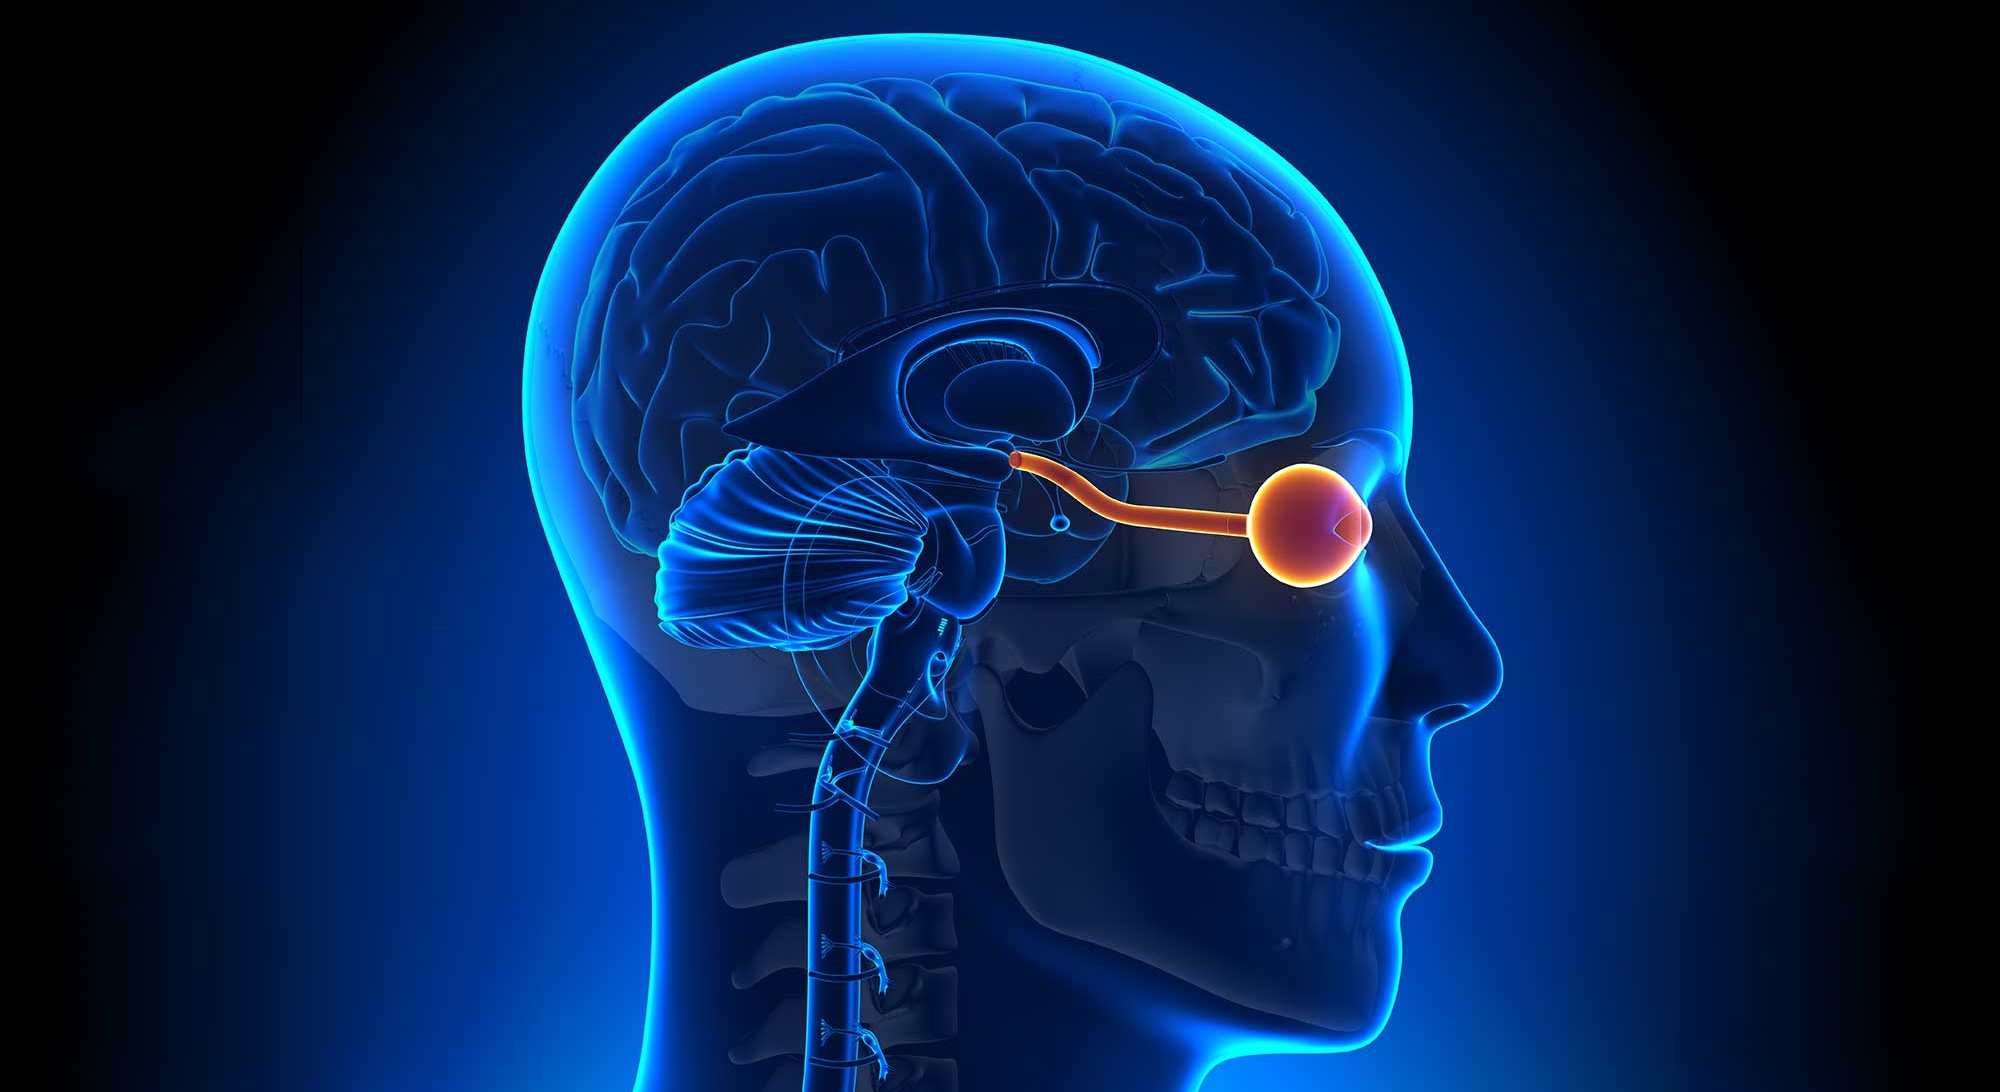
g-Ratio mapping of the optic nerve
By Hugo Albert Plante
Published on June 20, 2025
June 20, 2025
g-Ratio mapping of the optic nerve
About me

Hugo Albert Plante
I am a second-year undergraduate student in Biomedical Engineering at Polytechnique Montreal. I am passionate about science and guided by the belief that “impossible only means that you haven’t found the solution yet.” This mindset drives me to approach challenges with curiosity and persistence, always eager to discover innovative solutions that can make a difference.
Attending BHS as an undergraduate student was not a simple task, but it made the experience even more rewarding. My goal in participating was to kickstart part of my internship project, focused on developing a vendor-neutral g-ratio protocol for the optic nerve.
Project definition
Introduction
This project focuses on quantifying myelin integrity in the optic nerve using multimodal MRI. Multiple Sclerosis (MS) causes degradation of the myelin sheath surrounding nerve fibers, impairing neural communication (Ausmed, 2025). Measuring key parameters such as the g-ratio, Myelin Volume Fraction (MVF), and Fiber Volume Fraction (FVF) enables better understanding and monitoring of demyelination.
Using MRI-derived maps like T1 and FA, this project aims to compute these metrics non-invasively, providing valuable insights for research and clinical applications in neurological disorders like MS.
Background
Multiple Sclerosis and Neuronal Structure
Multiple sclerosis (MS) is an autoimmune disease that affect 2.8 millions peoples worldwide, as of 2020 (MS Canada, 2025). This disease occur when the body’s immune system mistakenly attack the myelin sheath, causing demyelination. A common early symptom of multiple sclerosis is optic neuritis, but as of 2024, it has also become a McDonald criteria for diagnosing MS (MS Trust, 2024).
g-Ratio: A key Metric in Myelin Studies
the g-ratio is a crucial parameter for quantifying the relative thickness of the myelin sheath. It is defined as the ratio between the inner axonal radius (r) and the outer myelinated radius (R) of a nerve fiber:
$$g=\frac{r}{R}$$
This ratio provides insight into myelin integrity and neuronal health.
Volume Fractions and their significance
- Myelin Volume Fraction (MVF) represents the proportion of myelin in a given tissue volume.
- Fiber Volume Fraction (FVF) represents the proportion of nerve fibers (axons plus myelin) in a given tissue volume.
- Macromolecular Tissue Volume Fraction (MTVF) represents the proportion of macromolecules (including myelin) in a given tissue volume.
- The relation between MVF and FVF relates directly to the g-ratio (Stikov et al., 2015):
$$\frac{MVF}{FVF}=1-g^2$$
Using two MRI modalities, MVF and FVF can be calculated non-invasively.
Imaging Techniques and Quantitatives Maps
- Macromolecular Tissue Volume Fraction is used as an indirect measure of myelin content. In white matter like the optic nerve, myelin composition approximatively 50% of MTVF (Mezer et al., 2013). It has been shown that MTVF can be derived from the actual value of T1 in an MRI voxel (Mezer et al., 2013):
$$\frac{1}{1-MTVF}=\frac{0.44202}{T1}+0.94766$$
- Fractionnal Anisotropy (FA) obtained from diffusion MRI, has shown have a quadratic relation FVF through simulations (Stikov et al., 2011):
$$FVF=0.883{FA}^2-0.082FA+0.074$$
These imaging-derived metrics allow assessment of neuronal integrity and demyelination in diseases like MS.
Main Objectives
- Develop a pipeline for mapping the g-ratio of the optic nerve
- Co-register MP2RAGE, DWI, and their derivatives to a common space (MNI 152)
- Compute g-ratio, MVF, and FVF from segmentations
- Calculate the mean g-ratio along each coronal slice of the optic nerve
Personal Objectives
- Improve my programming skills through real-world application
- Familiarize myself with version control tools such as Git and GitHub
- Gain hands-on experience in data processing and medical image analysis
- Contribute to the development of scientific research in biomedical engineering
Methods
Tools
- Jupyter notebooks for scripting
- BIDS standards for reproducibility and standardization
- Python for data vizualisation
- dMRI module and Spinal Cord Toolbox for inspiration and understanding
- BASH for automation
- ANTs for image registration
- 3D Slicer and FSLeyes for image visualization and ROI definition
- Git and GitHub for Version Control
- Python Packages: ‘matplotlib’, ’nibabel’, ‘pandas’, ’numpy’
Data
The data used in this study comes for NYU Abu Dhabi (private dataset), where the MP2RAGE and Diffusion MRI acquisitions were performed on 10 healty subjects. Manuals segmentations of the optic nerve were also perfromed for both modalities to extract the relevant MRI metrics.
For each subject, the dataset includes:
- A raw MP2RAGE image for T1 map extraction
- A denoised and defaced MP2RAGE UNI image
- A DWI b0 image for registration purposes
- A Fractional Anisotropy (FA) map obtained from a Siemens scanner
- Manual segmentations from both MRI modalities
A supplementary critical part of the project was the analysis of a maximum probability label for the optic eye comming form (Barranco Hernandez et al., 2024). The goal of this integration was to determine wether the maximum probability label could be used as a automated segmentation alternative to manual segmentations.
An exampale dataset will be upload to this GitHub repository once ethics approval from NYU has been obtained.
Project Deliverables
- A non-invasive method for mapping the g-ratio along the optic nerve
- An executable, reproducible pipeline that takes multimodal MRI as an input and outputs the mean g-ratio along the optic nerve
- Jupyter Notebooks for data visualization and statistical metrics extraction
Future Deliverable
- Interactive tutorial-style NeuroLibre publication with interactive figures and data
Methodology
Data Acquisition The dataset was acquired using a MP2RAGE and Diffusion MRI sequences on a 3T Siemens scanner located at NYU Abu Dhabi. Ten healthy subjects were scanned, with manual segmentations of the optic nerve performed on both modalities for ground-truth extraction.
Preprocessing Raw MP2RAGE UNI images were denoised and defaced to facilitate manual segmentation and registration. The denoising process reduces background noise that can interfere with the registration. Native FA maps provided by the scanner were used directly for FVF calculation. However, the FA map extraction and diffusion MRI preprocessing could be done with the diffusion MRI module’s preprocessing Jupyter Notebook (Brainhack School, n.d.) or Naghizadeh_project’s preprocessing pipeline (Naghizadeh, 2025).
Image Registration Accurate co-registration between MP2RAGE and DWI is critical due to the small size (~4-5 voxels wide) and the natural curvature of the optic nerve. Multiple registration strategies were tested, including rigid, affine, and elastic transformations, to optimize alignment while preserving anatomical integrity. Elastic registration methods tended to deform the optic nerve, resulting in segmentations inconsistencies, such as holes within manual masks. Ultimately, a combined rigid and affine registration approach was selected as the optimal balance between alignment and standardization to a template (MNI152). Additionally, another registration challenge occured because the DWI acquisitions covered only a slab including the optic nerve. This restriction made the aligment with the MP2RAGE full-volume more complicated.
Parameters Extraction Quantitative MRI parameters were extracted voxel-wise within the overlapping of both MRI modalities segmentation. This overlapping approach was necessary because DWI images are noisier, producing bulkier segmentation compared to the more precise MP2RAGE segmentation. T1 relaxation maps, obtained from MP2RAGE through qMRLab (qMRLab, n.d.), were used to compute the MTVF via the established formula. The MVF was then calculated by combining the MTVF values with the assumed myelin composition of the tissue. Native extracted FA values were converted to FVF using the quadratic relation derived form simulation (Stikov et al., 2011).
Modeling and Analysis The mean myelin volume fraction and mean fiber volume fraction were then used to calculate the mean g-ratio value along each coronal slice of the optic nerve.
Visualization and Output The final pipeline outputs include:
- Coronal slice-wise plot of MVF, FVF, and g-ratio in a standardized (MNI152) space
- Statistics metrics from each coronal slice including the dice coefficient between both modalities segmentations
Results
Since the dataset segmentations were not all completed by the submission date, the results presented here focus on only two subjects.
Image registration using registration.ipynb
The ‘registration.ipynb’ Jupyter Notebook contains the full registration workflow, starting from the raw MP2RAGE and DWI images and producing standardized results in the MNI 152 space.
The first cell of the pipeline sets up the bash environment variables and creates the necessary directories. As the project follows the BIDS data structure standard, each subject’s files should follow a directory tree similar to the example below:
Project Directory Structure (click to expand)
project_root/
└── data/
    ├── sub-XXX/
    │   ├── anat/
    │   │   └── sub-XXX_T1w.nii.gz
    │   └── dwi/
    │       └── sub-XXX_dwi.nii.gz
    │
    └── derivatives/
        ├── t1_map/
        │   └── sub-XXX/
        │       └── sub-XXX_t1_map.nii.gz
        ├── fa_map/
        │   └── sub-XXX/
        │       └── sub-XXX_scanner_FA.nii.gz
        ├── optic_nerve_segmentations/
        │   └── sub-XXX/
        │       ├── anat/
        │       │   └── sub-XXX_label-ON_seg.nii.gz
        │       └── dwi/
        │           └── sub-XXX_label-ON_seg.nii.gz
        │
        └── templates/
            ├── MNI152_T1_1mm.nii.gz
            ├── Atlas_MNI.nii.gz
            └── Optic_Nerve_Label_MNI.gz
Within this data structure, the only environment variables that require customization are ‘PROJECT_ROOT’ and ‘SUBJECT’. In this project, manual segmentations were performed directly on pre-rigidly registered DWI images, but the raw DWI image can also be used. Temporary derivative files are created in a designated directory, which can be safely deleted once the final results files are generated.
For each registration step, the type of registration can be easily modified in the notebook by changing the value the ‘-t’ parameter to:
- ‘r’ for rigid
- ‘a’ for affine
- ’s’ for nonlinear elastic (SyN) registration
The pipeline proceeds as follows:
- Rigid registration of DWI (automatically the b0 volume) to MP2RAGE
- Affine registration of MP2RAGE to MNI 152 template
- Application of transformations to:
- DWI to MNI
- DWI segmentation to MP2RAGE then to MNI
- FA map to MP2RAGE then to MNI
- MP2RAGE segmentation to MNI
- T1 map to MNI
- Creation of standardized Regions of Interest (ROIs) for DWI and MP2RAGE in MNI 152 space
- Rigid registration of DWI ROI to MP2RAGE ROI (secondary alignment)
- Application of ROI transformations to DWI, DWI segmentation, and FA map
- Generation of final results files
- Optional: Deletion of the temporary working directory
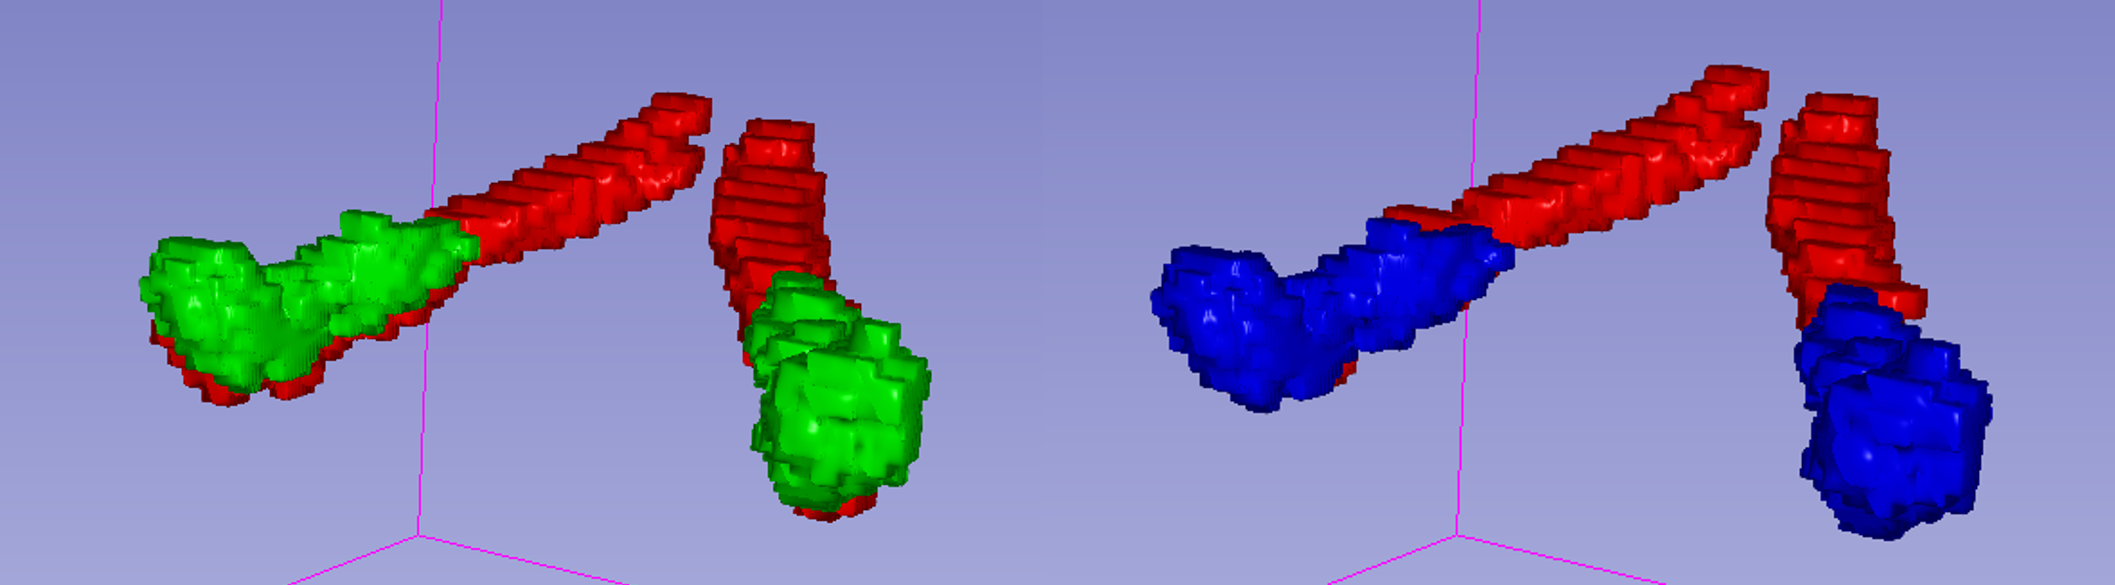
Step 4 and 5 are necessary because the initial registration introduced an offset in the segmentations. Therefore, the ROI co-registration step corrects this misalignement, as illustrated in the example below: red represents the MP2RAGE segmentation, green represents the DWI segmentation after the initial alignment, and blue represents the DWI after the ROI alignment correction.
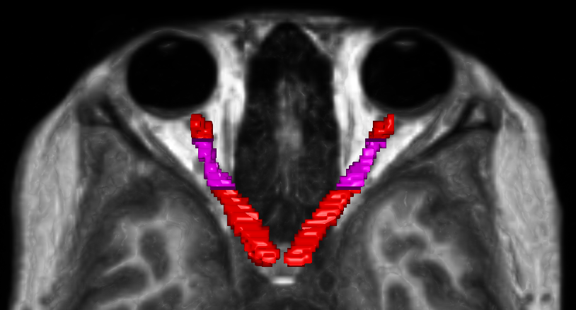
Additionally, outlying values were identified near the edges of both manual segmentations. To ensure plausible values along the optic nerve, Regions of Interest (ROIs) were defined, as illustrated in the example figure below.
Data visualization using data_visualization.ipynb
Assuming that the results directory and files were generated sucessfully, the only variable that need to be modified in the notebook are ‘PROJECT_ROOT’ and ‘SUBJECT’.
The main steps in the data visualization workflow are as follow:
- Load results files based on the specified ‘PROJECT_ROOT’ and ‘SUBJECT’.
- Extract various slice-wise metrics, including slice index, number of voxels in each segmenation, number of overlapping voxels, Dice coefficient, as well as the mean and standard deviation of T1 and FA values.
- Compute slice-wise MVF, FVF, and g-ratio using detailed equations and underlying assumptions.
- Summarize relevant metrics that characterize the overlap between segmentations.
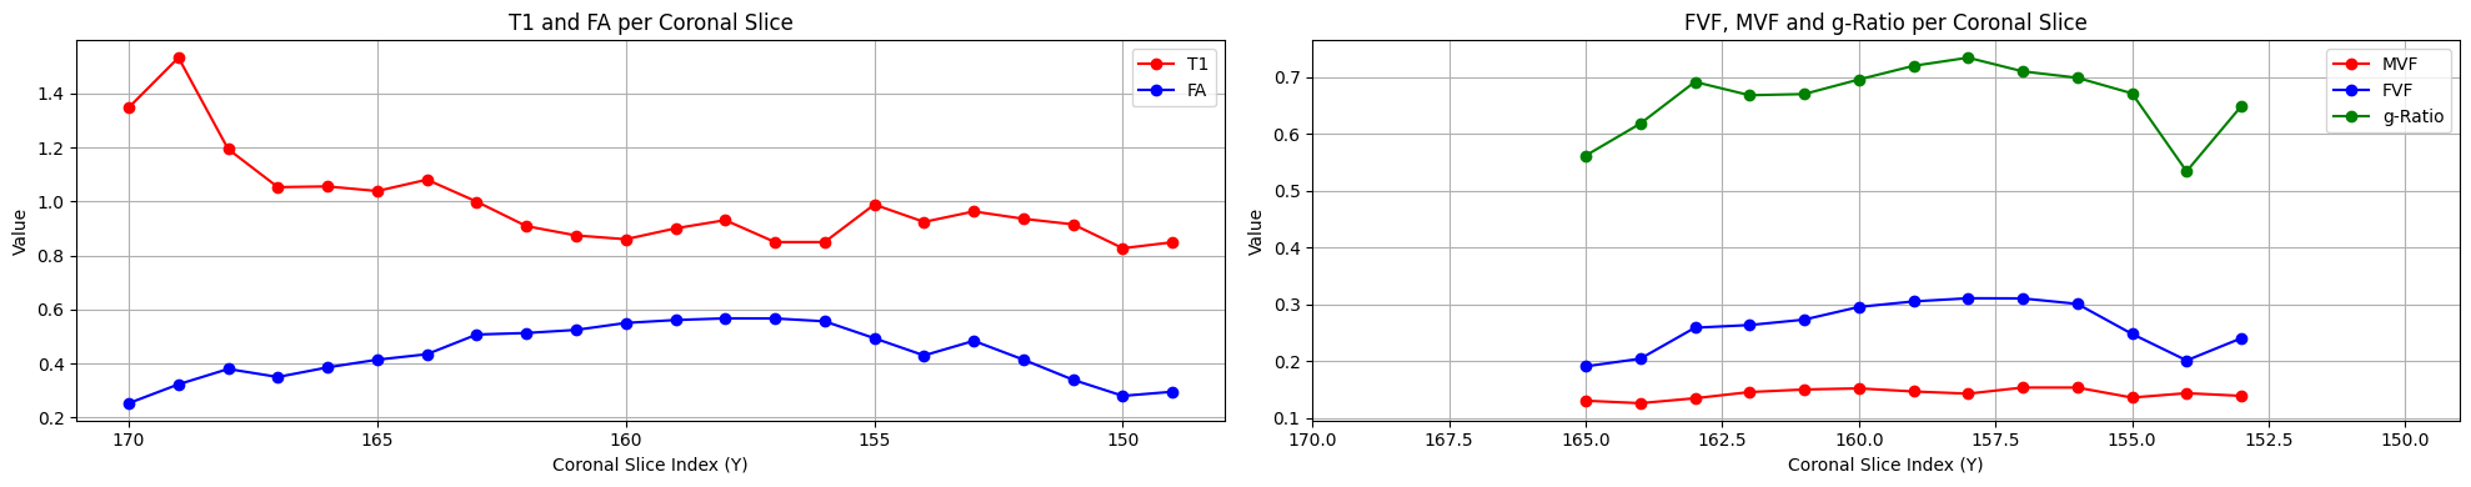
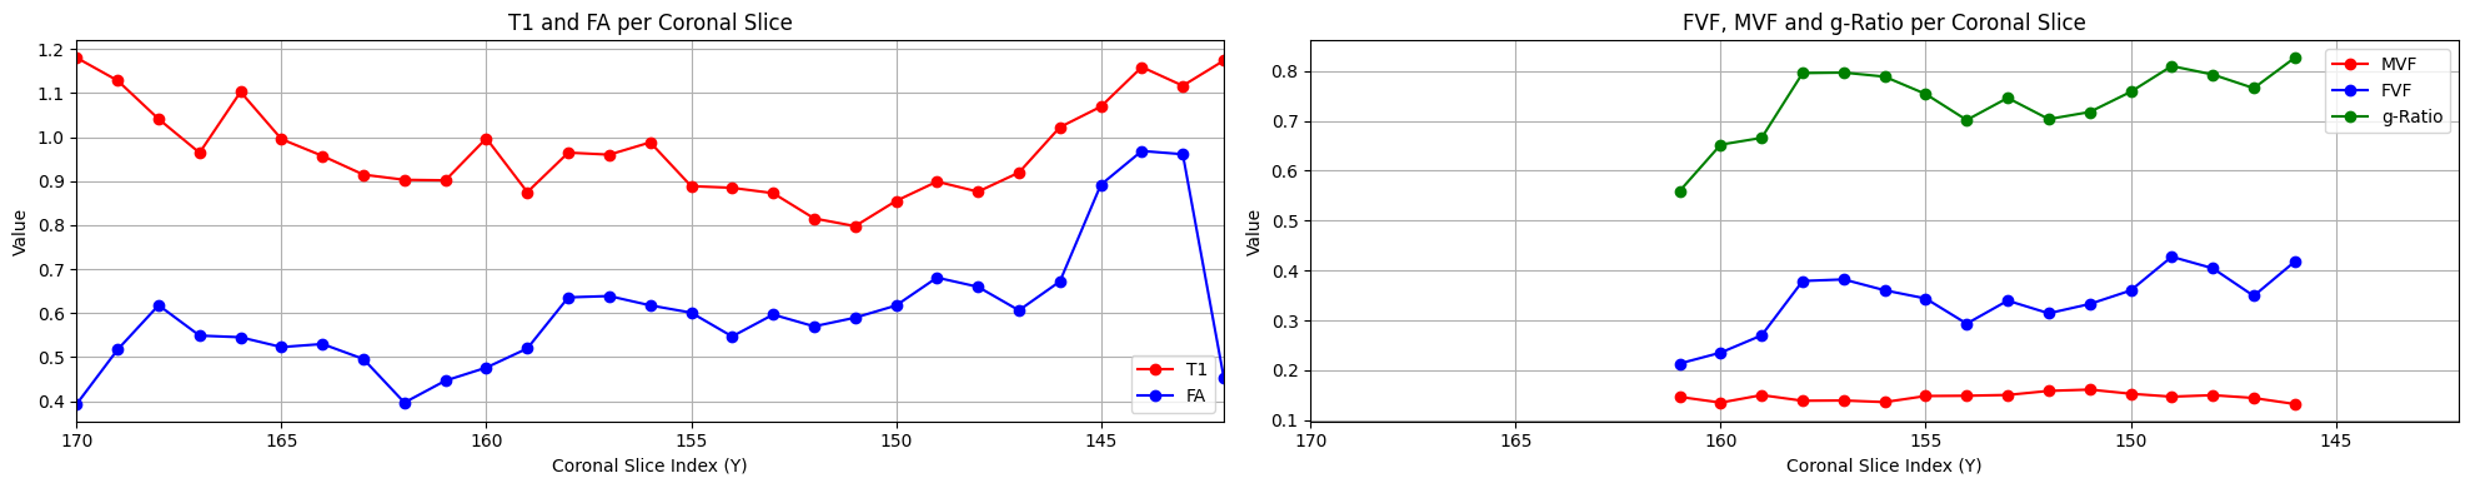
- Generate plots showing the slice-wise mean of T1, FA, FVF, MVF, and g-ratio, for visual interpretation
Segmentation Overlap Metrics Summary (whole optic nerve)
Segmentation overlap metrics showed moderate agreement between manual segmentations with Dice coefficients of 0.4961 ± 0.1703 and 0.3958 ± 0.1234 for subjects 1 and 2, respectively.
| Metric | Subject 1 | Subject 2 |
|---|---|---|
| Number of slices analyzed | 32 | 22 |
| Dice coefficient (mean ± std) | 0.4961 ± 0.1703 | 0.3958 ± 0.1234 |
| Average overlapping voxels/slice | 20.8 | 19.0 |
| T1 values inside overlap (mean ± std, s) | 0.99 ± 0.13 | 0.99 ± 0.17 |
| FA values inside overlap (mean ± std) | 0.5886 ± 0.1408 | 0.4370 ± 0.1013 |
| Mean MTVF (mean ± std) | 0.2736 ± 0.0278 | 0.2751 ± 0.0338 |
| Mean MVF (mean ± std) | 0.1368 ± 0.0139 | 0.1375 ± 0.0169 |
| Mean FVF (mean ± std) | 0.3486 ± 0.1594 | 0.2154 ± 0.0680 |
| Mean g-ratio (mean ± std) | 0.7329 ± 0.1019 | 0.5781 ± 0.1614 |
Results – MVF, FVF & g-Ratio
Plausibles results were obtained for regions of interest (ROIs) in the optic nerve, with calculated g-ratio values ranging between 0.6 and 0.8 for each subject. The calculated mean for each coronal slice includes both the right and the left optic nerves.
Subject 1
Subject 2
Tools that I learned during this project
- Python for data processing, scripting, and analysing
- Jupyter Notebooks to organize and run interactive data workflows
- ANTS (Advanced Normalization Tools) for medical image registration and transformation
- Git and GitHub for version control and project collaboration
- BIDS for standardization of the data structure
Results
Deliverable 1:
A non-invasive method for visualize the mean g-ratio along the coronal slices of the optic nerve.
Deliverable 2:
An executable and fully reproducible processing pipeline that:
- Takes multimodal MRI inputs
- Computer and outputs the mean g-ratio along the optic nerve
- Includes Jupyter Notebooks for data visualization and extraction of relevant statistical metrics
Conclusions
Can we visualize the g-ratio value along the optic nerve?
Yes. Using the developed pipeline, we successfully mapped and visualized the g-ratio values along the optic nerve in a reproducible and non-invasive manner. This provides meaningful insight into myelin integrity and fiber composition in differents subjects.
Encountered issues
Atlas max probability optic nerve label
The max probability optic nerve label was initialy used to assess whether manual segmentation was truly necessary, or if this atlas-based label could serve as an automated segmentation alternative. Howerver, the Dice coefficient between the overlapping regions of both manual segmentations and the maximum probability atlas label ranged only from 15% to 20%. Given this low similarity, the maximum probability label was excluded from further analysis.
Registration issue
As previously stated, two registrations issues were encountered. The first was related to the small size (~4-5 voxels wide) and the natural curvature of the optic nerve. Non-affine or elastic registrations tended to deform the optic nerve and create hole in the transformed manual segmentation masks. The second issue involved the alignment of the two manual segmentations: a single rigid registration resulted in an approximate one-slice offset. However, applying a second rigid registration using ROIs was able to correct this initial misalignment.
MTVF vs MVF
Initialy, it was assumed that myelin constitutes nearly 100% of the macromolecular content in white mater like the optic nerve. This assumption led to an overestimation of the Myelin Volume Fraction (MVF) by Macromolecular Tissue Volume Fraction (MTVF), resulting in non-plausible results such as more myelin than fiber. An litterature search revealed that myelin accounts for only 50% of the macromolecular content in white matter. With this correction, plausible values of g-ratio were acheived.
Guide to Reproducibility
This project follows the BIDS data structure for standardized input. To reproduce results:
- Clone the repository
git clone https://github.com/brainhack-school2025/albert-plante_project.git
cd albert-plante_project
- Set up a Python virtual environment
For Linux/Mac:
python3 -m venv .venv
source .venv/bin/activate

For Windows:
python -m venv .venv
.venv\Scripts\activate
- Install required Python packages
pip install -r requirements.txt
- Install Jupyter Notebook
pip install notebook
- Install ANTs and FSL
- Organize data according to BIDS format under ‘PROJECT_ROOT’.
- Modify subject variabes in the notebooks (‘PROJECT_ROOT’ and ‘SUBJECT’)
- Run ‘registration.ipynb’ to co-register images and create results files.
- Run ‘data_visualization.ipynb’ to extract metrics and generate plots.
- Optional: Clean temporary directories to save space.
Troubleshooting
- Registration issues: Because the DWI is normally a slab, multiples rigid registration between DWI and MP2RAGE can be needed because the registration algorithm can fail.
- Missing dependencies: Ensure all Python packages and ANTs binaries are installed and accessible in your environment path.
- File path errors: Verify your BIDS directory structure and that environment variables point to correct locations.
- Plotting errors: Create the metrics dataframe before visualization.
Acknowledgement
I would like to thank Nikola Stikov and Agah Karakuzu for their mentorship and expertise, as well as Bas Roker and Ameen Qadi from the Rokers Vision Laboratory in NYU Abu Dhabi. Special thanks also to Eva Alonso Ortiz and Sebastian Rios, the professor and teaching assistant of the course, for their guidance and support.
References
Ausmed. (2025, 01). How Does Multiple Sclerosis Affect the Body? | Ausmed. https://www.ausmed.com/learn/articles/multiple-sclerosis-nursing-care
Barranco Hernandez, J., Luyken, A., Kebiri, H., Stachs, P., Macias Gordaliza, P., Esteban, O., Aleman Gomez, Y., Sznitman, R., Stachs, O., Langner, S., Franceschiello, B., & Bach Cuadra, M. (2024). Eye-Opening Advances: Automated 3D Segmentation, Key Biomarkers Extraction, and the First Large-Scale MRI Eye Atlas. https://doi.org/10.1101/2024.08.15.608051
Brainhack School. (n.d.). Training modules. Retrieved June 19, 2025, from https://school-brainhack.github.io/modules/
Duval, T., Stikov, N., & Cohen-Adad, J. (2017). Modeling white matter microstructure. Functional Neurology, 31(4), 217–228. https://doi.org/10.11138/FNeur/2016.31.4.217
Mezer, A., Yeatman, J. D., Stikov, N., Kay, K. N., Cho, N.-J., Dougherty, R. F., Perry, M. L., Parvizi, J., Hua, L. H., Butts-Pauly, K., & Wandell, B. A. (2013). Quantifying the local tissue volume and composition in individual brains with magnetic resonance imaging. Nature Medicine, 19(12), 1667–1672. https://doi.org/10.1038/nm.3390
MS Canada. (2025, February 7). Prevalence and incidence of MS in Canada and around the world | MS Canada. https://mscanada.ca/ms-research/latest-research/prevalence-and-incidence-of-ms-in-canada-and-around-the-world
MS Trust. (2024, 11). McDonald criteria | MS Trust. https://mstrust.org.uk/a-z/mcdonald-criteria
Naghizadeh, Y. (2025). Naghizadeh_project. https://github.com/brainhack-school2025/Naghizadeh_project
NeuroLibre. (n.d.). Retrieved June 19, 2025, from https://neurolibre.org
qMRLab. (n.d.). Home | qMRLab. Retrieved June 19, 2025, from https://qmrlab.org/
Rokers Vision Laboratory. (n.d.). Retrieved June 19, 2025, from https://sites.nyuad.nyu.edu/rokersvisionlaboratory/
State University of New York College of Optometry. (2019, December 11). Scientists Discover the Origin of Brain Mapping Diversity for Eye Dominance [Video]. SciTechDaily. https://scitechdaily.com/scientists-discover-the-origin-of-brain-mapping-diversity-for-eye-dominance-video/
Stikov, N., Campbell, J. S. W., Stroh, T., Lavelée, M., Frey, S., Novek, J., Nuara, S., Ho, M.-K., Bedell, B. J., Dougherty, R. F., Leppert, I. R., Boudreau, M., Narayanan, S., Duval, T., Cohen-Adad, J., Picard, P.-A., Gasecka, A., Côté, D., & Pike, G. B. (2015). In vivo histology of the myelin g-ratio with magnetic resonance imaging. NeuroImage, 118, 397–405. https://doi.org/10.1016/j.neuroimage.2015.05.023
Stikov, N., Perry, L. M., Mezer, A., Rykhlevskaia, E., Wandell, B. A., Pauly, J. M., & Dougherty, R. F. (2011). Bound pool fractions complement diffusion measures to describe white matter micro and macrostructure. NeuroImage, 54(2), 1112–1121. https://doi.org/10.1016/j.neuroimage.2010.08.068