Images10K Compendium
By Sara Barbu, & Lune Bellec
Published on June 18, 2025
June 18, 2025

Project definition
Background
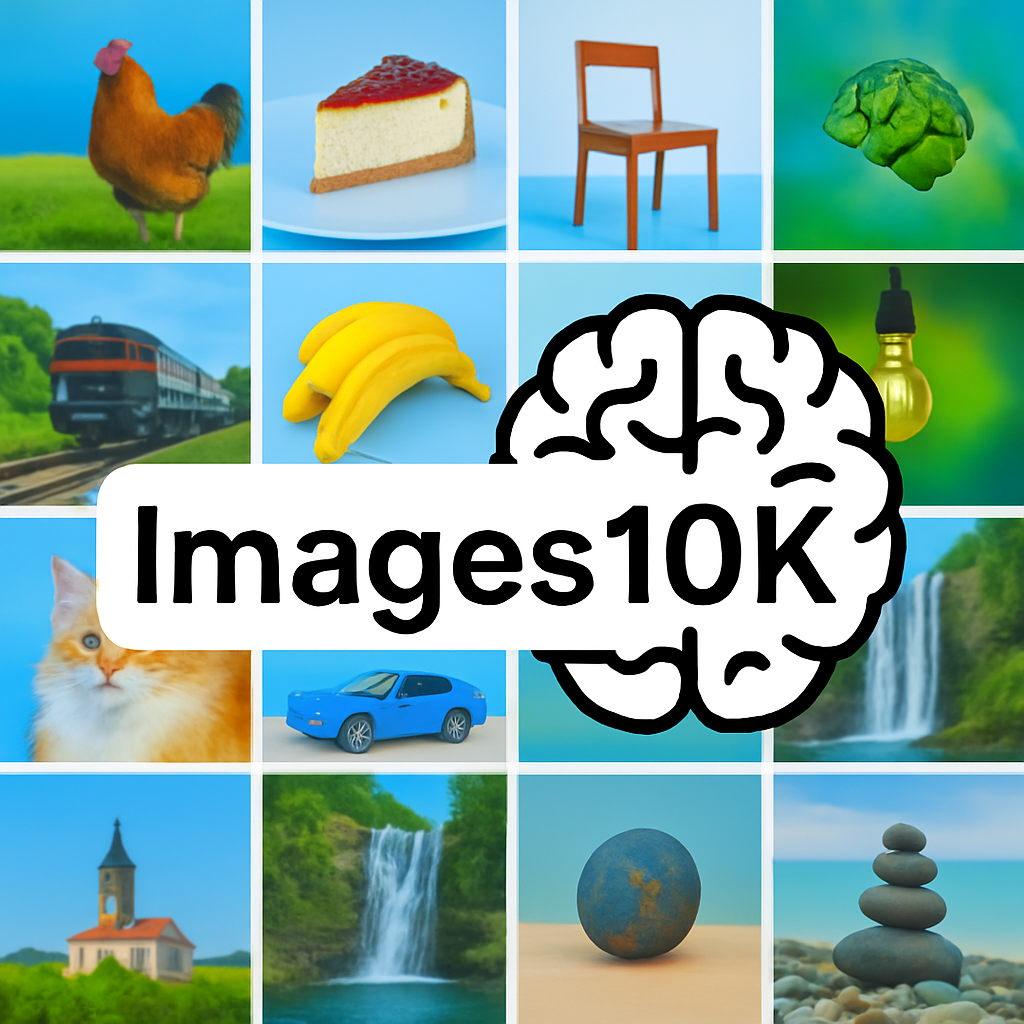
Many studies in cognitive neuroscience still use really simplified or artificial images, like objects on plain backgrounds.That can limit ecological validity and create a disconnect between what you see in the lab and real world perception. In contrast to that, Images10K provides naturalistic scenes, showing objects in their natural environments, which makes it easier to study how people understand visual scenes in real-world contexts. This approach fits with recent work that emphasizes the importance of using more realistic images in research (Hosu, Lin, Szirányi, & Saupe, 2019).
This project is based on the Images10K dataset — containing over 8,000 naturalistic images, annotated by human participants on the Zooniverse platform. The overall goal is to provide a well-organized and richly annotated image set (8,382 images, 15 semantic categories) that can be reused for training visual recognition models in AI and neuroscience
Tools
- GitHub for version control and to organize the project in a clear, collaborative, and shareable format.
- DataLad to retrieve and manage the dataset in a reproducible way.
- Python scripts to filter images by category, convert metadata formats, and prepare image paths for display.
- Jupyter Notebooks to explore the metadata, test visualizations, and generate previews of the dataset.
- Dash Bootstrap Components to build interactive UI elements like carousels and dropdown menus for browsing images.
- MyST Markdown to structure the content of the interactive website and document the project cleanly within Jupyter Book.
- Ubuntu terminal to navigate the file system, run scripts, and better understand how to work with files and folders at the command line.
Data
The dataset includes:
- Over 8,000 naturalistic images, stored in semantically organized folders based on object categories
- Annotated labels for each image, including category, subcategory, and file path
- High-level semantic classifications (e.g., living vs. non-living, natural vs. artificial)
- Rich image-level metadata such as:
- Number of participant annotations (via Zooniverse)
- Inter-participant agreement scores
- License information and usage permissions
- Source URLs and author attributions
Deliverables
- A structured GitHub repository with scripts, metadata, and documentation
- Jupyter Notebooks for metadata preview and exploratory analysis
- An interactive web interface built with Jupyter Book and MyST Markdown
- Image carousels and scrollable metadata tables for category-based exploration
- Downloadable metadata files hosted via Google Drive
Results
Tools I learned during this project
Tools are listed above in the Tools section
Results
Deliverable:
Link to view google slide presentation
Link to the Image10k-Compendium Website
You can view the full project and explore the carousels here:
Image10k Compendium Website
Note Only a limited set of images is included on the website due to GitHub storage and bandwidth constraints.
Note The interactive carousels (Dash apps) require Python to run, so they won’t launch directly in the website view.
To view the carousels interactively on the Website:
Clone this repository:
Images10k-compendiumInstall dependencies:
pip install -r binder/requirements.txtRun both notebooks in the
content/folder:animated_being.ipynbObjects.ipynb
Conclusion and acknowledgement
This project helped me learn how to organize data and build interactive visual tools using Dash and Jupyter. I also got more comfortable working with GitHub and sharing work online.
Thanks to Lune, Marie, Cléo, and the whole BrainHack School team for all the help and support along the way!


