Identifying Potential Biomarkers for Parkinson’s Disease Using Neurite Orientation Dispersion and Diffusion Imaging (NODDI)
By Samuelle St-Onge
Published on January 1, 0001
| Last updated on
January 1, 0001
Project definition
Background
Parkinson’s disease is a neurogenerative disease for which we currently do not have any cure. Although there are treatment options available, early diagnosis is key to be able to start the treatment early and slow down the progression of the disease. However, since there are still a lot of things we don’t quite understand about Parkinson’s disease, it is oftentimes difficult to diagnose at early stages. During this project, I will be exploring the use of NODDI (a diffusion MRI technique) applied to spinal cord images in the case of Parkinson’s disease. More specifically, I will be applying NODDI to spinal cord images acquired from Parkison’s disease patients at various stages of the disease to identify potential biomarkers for Parkinson’s disease, with the ultimate goal of helping clinicians diagnose the disease at an earlier stage, thus allowing early treatment to slow the progression of the disease. In recent work, diffusion MRI has shown a potential interest for finding biomarkers in the context of neurodegenerative diseases such as Parkinson, using Neurite Orientation Dispersion and Diffusion Imaging, commonly known as NODDI.
NODDI is a diffusion MRI technique which aims to extract metrics based on the morphology of neurites, which are composed of dendrites and axons. The most common metrics that can be extracted from NODDI (Mitchell et al., 2019) are :
- Orientation Dispersion Index (ODI) : Measures the variability in neurite orientation
- Neurite Density Index (NDI) : Measures the density of neurites
- Isotropic Volume Fraction (Viso) : Measures the fractional volume of extracellular fluid
My project aims to use an existing open-source NODDI toolbox to perform NODDI fitting of a spinal cord diffusion MRI dataset containing both healthy subjects and subjects diagnosed with Parkinson’s disease. Then, using the data analysis tools and skills I have learned during BrainHack School, I have written a Python script to analyze the extracted metrics from the NODDI model fitting, which will then help me compare the metrics with the progression of the disease and identify potential biomarkers for Parkinson’s disease.
Why NODDI for Parkinson’s disease?
- Literature has shown an interest in diffusion MRI to identify potential Parkinson’s disease biomarkers in brain images (Zhang et al., 2012)
- Links have been found between neurite morphology and other neurodegenerative diseases, such as multiple sclerosis (Zhang et al., 2012)
Why spinal cord images for Parkinson’s disease biomarkers?
- Spinal cord lesions have been recorded in Parkinson’s disease patients (Tredici et al., 2012)
- To our knowledge, NODDI in the spinal cord for Parkinson’s disease patients has not yet been studied
Tools
For NODDI fitting :
Matlab :
- NODDI Matlab Toolbox (UCL Microstructure Imaging Group, 2021)
- Matlab Parallel Computing Toolbox
- Matlab Optimization Toolbox
For registration and NODDI metric extraction :
- The Spinal Cord Toolbox (De Leener et al., 2017)
For data analysis :
Python :
For version control :
- Git and Github
Data
For this project, I have used a spinal cord dataset from our collaborators at McGill University. This dataset contains a total of 113 subjects, from which 87 have been diagnosed with Parkinson’s disease at various stages of the disease (“low”, “medium” and “advanced” stages) and the remaining 26 are healthy control subjects. The dataset contains other common MRI modalities, such as T1-weigthed and T2-weighted images. However, for the scope of BrainHack School, I have decided to focus only on the diffusion images.
Deliverables
Matlab script to perform multi-subject NODDI fitting using the NODDI Matlab Toolbox (UCL Microstructure Imaging Group, 2021)
Python script to compute average NODDI metrics and display average images for each subject category (control subjects, low PD, medium PD and advanced PD)
Python script to perform data analysis, i.e. regression plots to display and compare metrics (such as ODI, NDI and Viso) with Parkinson’s disease progression.
Results
Progress overview
The following diagram summarizes the key stages of the methods used for my project :
NODDI fitting :
Starting with the diffusion MRI images from the dataset, I first performed NODDI fitting using the NODDI Matlab Toolbox (UCL Microstructure Imaging Group, 2021) from UCL Microstructure Imaging Group. Using this toolbox, I wrote a Matlab script to be able to perform multi-subject NODDI fitting with a BIDS-compliant dataset. The NODDI Matlab Toolbox also gives the user the option of using the Matlab Parallel Computing Toolbox, which speeds up the fitting process significantly.
For the inputs, the NODDI Matlab Toolbox requires diffusion MRI files (sub-PXXX_dwi.nii, sub-PXXX.bvec, sub-PXXX.bval). It is also possible to specify a mask, in order to restrict the fitting to a certain region of the image (for example, only the spinal cord). In this specific project, I used segmentation files that had already been performed on 42 subjects prior to BrainHack School, by a previous graduate student. Initially, my goal was to start by performing NODDI fitting and metric analysis for these 42 subjects with the segmentation files, and then go back and segment the remaining subjects and re-run the NODDI fitting and metric analysis pipeline for the whole dataset. Howerver, I did not have enough time to go back and do the segmentation during BrainHack School. For this reason, I decided to focus only on 42 of the 113 subjects in the dataset for my Brainhack School project.
Registration to PAM50 template
Following NODDI fitting, I decided to perform registration on the output metrics to be able to compute an average metric for each subject category : control, low disease, medium disease and advanced disease.
To perform the registration, I used the Spinal Cord Toolbox (SCT) and followed the recommended steps in the documentation.
The following diagram shows a summary of the Spinal Cord Toolbox pipeline for registration to the PAM50 template with DWI images :
*Detailed explanations for each of these steps can be found in the Spinal Cord Toolbox DWI tutorial.
Metric extraction using the Spinal Cord Toolbox
Following NODDI fitting, to extract the values of the ODI, NDI and Viso metrics (which were all in NIFTI format following the NODDI fitting process with Matlab), I used the command sct_extract_metric from the Spinal Cord Toolbox. The following diagram shows a summary of the command amd the arguments that were used for my project :
The command sct_extract_metric outputs a .csv file for the metric from the file specified in the -i argument. For this specific project, I chose the labels 50, 51 and 52 with the -l argument, which correspond to the spinal cord, white matter and gray matter. I also chose to extract metrics from C2 to C5, using the -vert argument.
Results
Computing average metrics
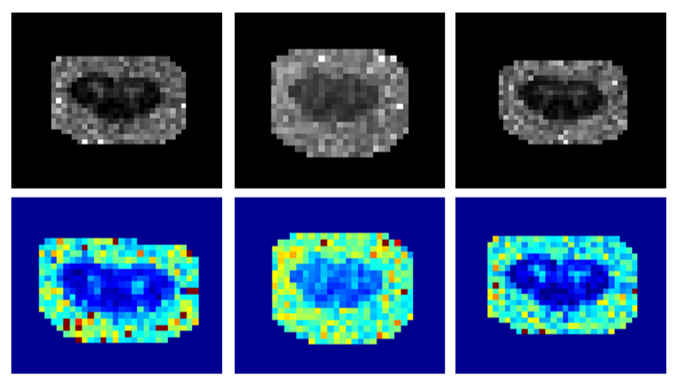
Following the registration to the PAM50 template, I have written a Python script to compute average metrics and display them as images. The following image shows an example of the average orientation dispersion index (ODI) for each subject category (control, low PD, medium PD and advanced PD).
By looking at the image above, we can notice an offset between the images used to compute the average. This is most likely due to a problem with the registration step. Following BrainHack School, I would like to try the registration with different parameters to see if I can fix this offset.
Regression plots
I have also written a Python script for data analysis, which takes the metrics from the .csv files obtained with the sct_extract_metric command to do regression plots. The image below shows an example of the regression plots that can be achieved with this script.
The plots are divided by vertebrae level (in this example, from C2 to C5) as well as by label (white matter, gray matter and spinal cord). In each plot, we can observe the metric with the progression of the disease (from control subjects to advanced Parkinson’s disease subjects).
In this specific project, since I have used only 42 subjects, there is not enough data to draw any conclusions, nor identify potential biomarkers for Parkinson’s disease. Also, future versions of the Python script should include a regression model with p-values, to be able to perform a more rigorous statistical analysis.
In future work, after having improved the python script to include p-values, I would like to perform the analysis for the entire dataset (113 subjects). By repeating the analysis with the entire dataset, I would suspect seeing an increase in ODI in the white matter and a decrease in ODI in the gray matter, since these have been linked to neurodegeneration according to literature (Zhang et al., 2012).
Limitations and future work
Following BrainHack School, I would like to pre-process the entire dataset, by also adding motion correction using the Spinal Cord Toolbox. I would also like to use a larger mask to perform the NODDI fitting. As I mentionned in the “Methods” section above, in this project I used segmentation files as a mask for the NODDI fitting. However, it would be interesting to try a mask that is larger than the segmentation of the spinal cord to see if it can help reduce potential partial volume effect. Furthermore, I would like to try performing the registration to the PAM50 template prior to the NODDI fitting, to be able to extract the metric values and compute average images directly from the output metrics.
Regarding the metric analysis, I would like to try the registration to the PAM50 template with different parameters to fix the offset I have with the current results. For the regression plots, it would be important to consider the age as a control variable, to avoid overestimating the effect of Parkinson’s disease progression when performing the regression analysis. Finally, I would like to incorporate a regression model with p-values to perform more rirogous statistics on the different NODDI metrics.
Conclusion and acknowledgement
As a new PhD student, BrainHack school was a great opportunity for me to learn about the basics of neuroscience imaging and data analysis. Although there are still some improvements to be made regarding my project, I look forward to apply the tools and skills I have learned during BrainHack School to work on improving what I have implemented so far.