Modulation of functional connectivity in Parkinson’s disease with neuropsychiatric symptoms
By Roqaie moqadam
Published on June 9, 2023
June 9, 2023
Project definition
Background
Inspired by the https://alz-journals.onlinelibrary.wiley.com/doi/full/10.1002/trc2.12371, this project has defined which aims to investigate the functional connectivity patterns in individuals with Parkinson’s disease and neuropsychiatric symptoms (PD+NPS) compared to those without the NPS. The study utilizes resting-state fMRI data to analyze the connectivity matrix and identify alterations in functional brain networks associated with PD+NPS. The project also involves familiarizing with data science packages, interpreting neuroimaging data, and advanced visualization techniques. The findings may contribute to understanding the neural mechanisms underlying PD+NPS and inform future research and interventions. The project involves BIDS validation, fMRI preprocessing, functional connectivity analysis, group comparisons, and prediction modeling for mild cognitive impairment.
Tools
- Jupyter notebook for coding and visualization
- Docker container
- fMRIPrep for rs-fMRI preprocessing
- Python Packages: matplotlib, seaborn, nilearn, plotly, Nibabel, scipy, Pandas
- Git and Github for Version Control
Data
The pilot version of this project currently utilizes small raw data from the Niemolab for analysis. However, the intention is to eventually incorporate data from a larger Parkinson’s disease (PD) cohort for a more comprehensive investigation. The use of a larger dataset will enhance the generalizability and statistical power of the findings, allowing for a more robust understanding of the functional connectivity patterns in PD with neuropsychiatric symptoms (PD+NPS).
Deliverables
Jupyter notebooks: Share interactive code, analysis, and visualizations. Organize project code, preprocessing steps, analysis, and results. Share notebook files (.ipynb) Jupyter notebooks for code and analysis GitHub for version control and collaboration
Results
BIDS Validation in Raw Neuroimaging Dataset
The BIDS Validator is a tool that verifies if neuroimaging datasets adhere to the BIDS standard, promoting organized and correctly formatted data for enhanced data sharing and reproducibility in neuroimaging research. In the case of the “mp1014” subject dataset, it identified 2 errors and 1 warning in 62 files. I utilized the error log for subjectmp1014 and subsequently ran fmriprep for the dataset.

Running fMRIPrep with Docker: Preprocessing fMRI Data for Multiple Participants
I executed the following command on my local machine to run fMRIPrep using Docker for 5 subjects:
docker run -ti –rm
-v $HOME/subjectmp1014:/data:ro
-v $HOME/outputmp1014:/out
-v $HOME/freesurfer/license.txt:/opt/freesurfer/license.txt
nipreps/fmriprep:latest
/data /out
participant –participant_label {sub-mp0010,sub-mp0011,sub-mp0012,sub-mp0013,sub-mp0014 –skip-bids-validation


Functional Connectivity Analysis and Group Comparison using Harvard Atlas
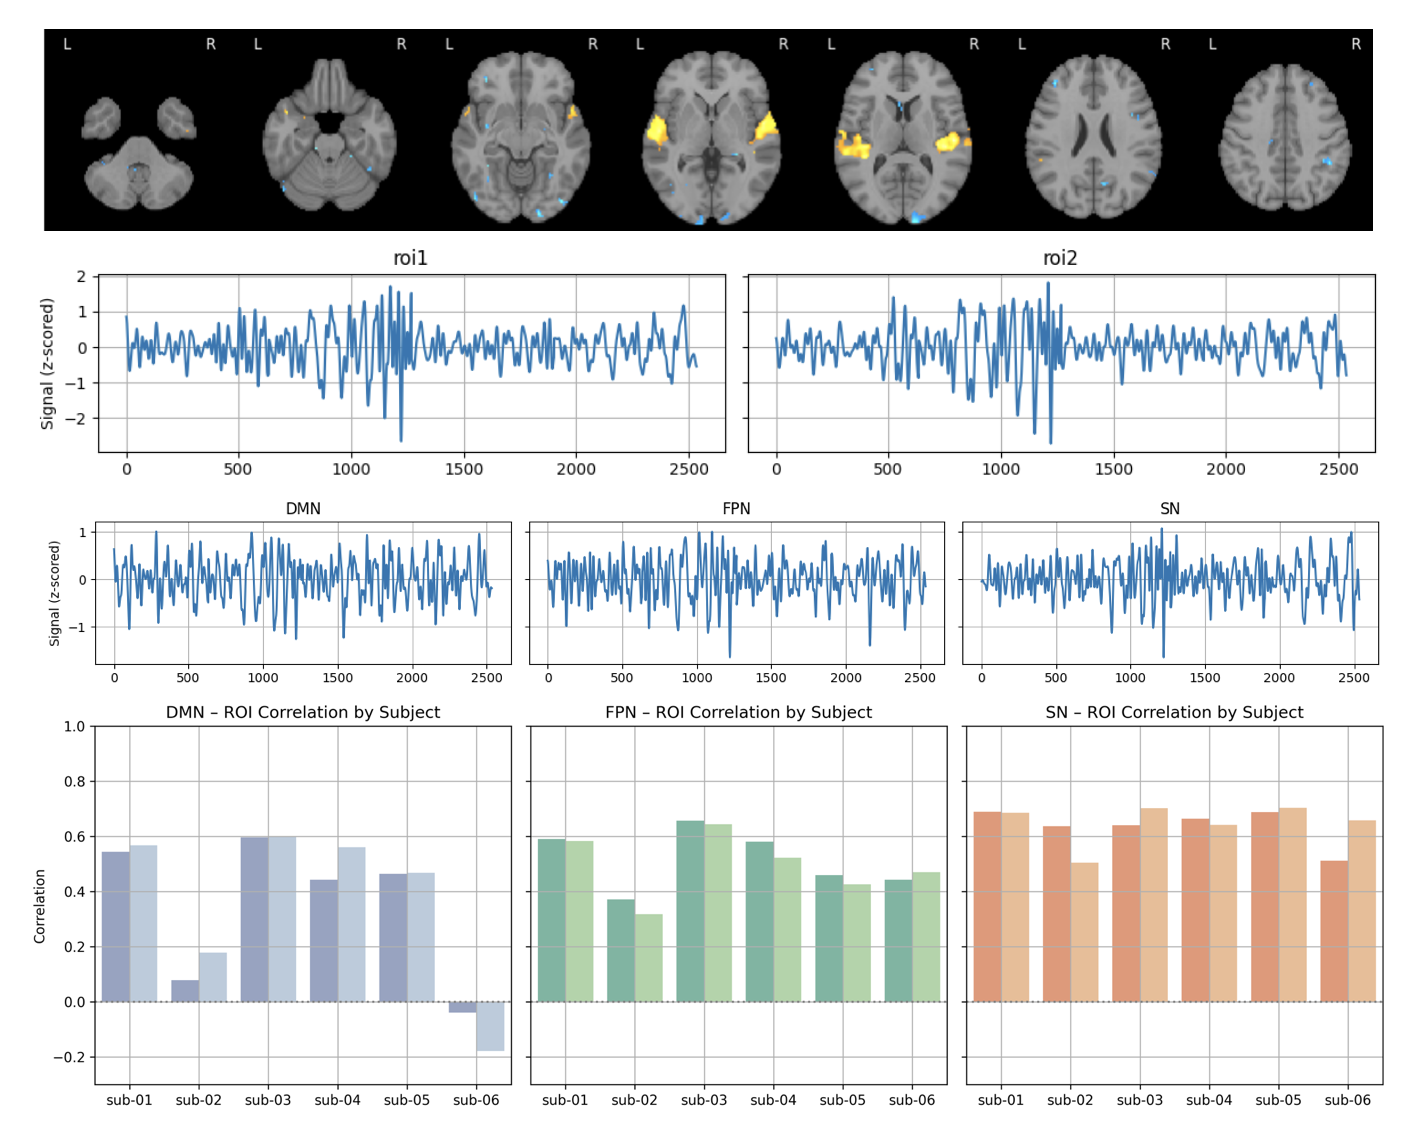
This analysis aimed to investigate functional connectivity patterns and group differences using the Harvard atlas. The preprocessed data and confound information were imported from the specified directory. The Harvard atlas was utilized for defining brain regions of interest. The functional connectivity matrix was extracted, and subjects were divided into depressed and non-depressed groups based on BDI scores.
Connectivity matrices were computed for each subject, and mean matrices were calculated for the depressed and non-depressed groups.


Data Processing and Grouping based on BDI Scores for Connectivities Analysis
Data processing and grouping based on BDI scores were performed to investigate connectivities. The data consisted of preprocessed functional connectivity data and BDI scores obtained from participants. The functional connectivity matrix was computed, and subjects were categorized into depressed and non-depressed groups based on their BDI scores.
Connectivity matrices were created for each subject, and group-level analyses were conducted. The results demonstrated distinct patterns of connectivity between the depressed and non-depressed groups. These findings highlight the potential differences in brain network organization associated with depression.
Updating and Filtering Correlation matrix for Analysis

Updating and Filtering Correlation matrix based on label of interest
Updating and filtering the correlation matrix to focus our analysis on specific regions of interest and their associations with neurobehavioral data, improved the accuracy and relevance of the data, allowing us to uncover meaningful insights and generate hypotheses for further investigation.


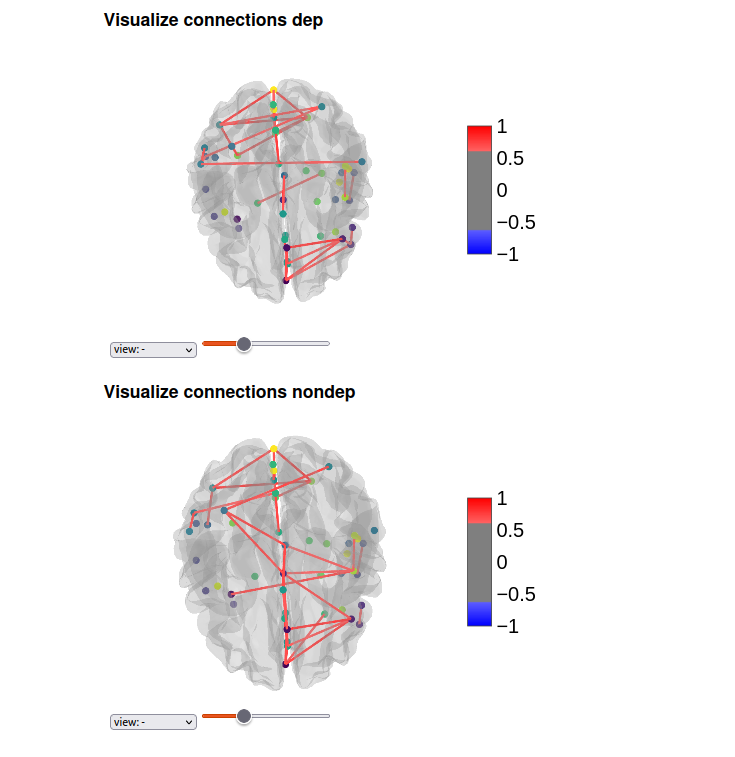
Ploting of Functional Connectivity in Depressed and Non-Depressed Groups
The aim of this analysis was to visualize atlas-based coordinates for depressed and non-depressed groups. Coordinates were obtained using the specified atlas, and separate visualizations were created for each group. The connectivity patterns and spatial distribution of these coordinates were examined. The visualizations revealed distinct patterns of connectivity and spatial organization in the depressed and non-depressed groups. These findings provide valuable insights into the differences in brain network architecture associated with depression. The visualizations serve as a powerful tool for understanding and interpreting the complex connectivity patterns in different brain states.


Connectivity Distribution by Group: Depressed vs. Non-Depressed
This analysis aimed to explore the distribution of connectivities between depressed and non-depressed groups. The connectivities were obtained from participants belonging to these two groups. A box plot was created to visualize and compare the connectivity distributions.
The results of the T-test revealed a significant difference in connectivities between the depressed and non-depressed groups (T-Statistic: -2.1286, P-Value: 0.0348). This indicates that there are distinct patterns of brain connectivity associated with depression. These findings suggest that neuroconnectivity analysis could potentially serve as a valuable tool for understanding and identifying markers of depression.

Linear Regression Model for MCI Prediction
This study aimed to predict Mild Cognitive Impairment (MCI) using connectivities and BDI scores. The dataset was split into training and test sets (80% training, 20% test). A linear regression model was created, trained on the training set, and used to predict MCI values for the test set. The model’s performance was evaluated using Mean Squared Error (MSE) and R-squared (R2). The MSE was 0.279, indicating the average squared difference between predicted and actual MCI values. The R2 value was -0.115, suggesting the model did not explain much variance in MCI. In summary, the linear regression model showed limited success in predicting MCI using connectivities and BDI scores.

Mixed Effects Linear Regression Model for MCI Prediction:
A mixed effects linear regression model was developed to predict Mild Cognitive Impairment (MCI) using connectivities and BDI scores. The dataset was split into training and test sets (80% training, 20% test). After fitting the model, predictions were made on the test set. The evaluation of the model yielded a Mean Squared Error (MSE) of 0.250 and an R-squared (R2) value close to zero. The MSE represents the average squared difference between predicted and actual MCI values, while R2 indicates the proportion of variance in MCI explained by the model. In summary, the mixed effects linear regression model showed limited success in predicting MCI using connectivities and BDI scores. The convergence warning suggests potential issues with model estimation.

Progress overview
I have encountered obstacles during the project that affected the speed, particularly due to the utilization of lab data and local machine instead of server for preprocessing. However, I am actively working on removing these obstacles to improve the efficiency and speed.
Tools I learned during this project
Throughout this project, I have gained proficiency in several tools and technologies, including:
* Jupyter Notebooks
* GitHub
* BIDS Validator
* High Performance Computing
* Data Visualization Tools (specifically Nilearn)
These tools have been instrumental in facilitating code development, version control, data validation, efficient computing, and data visualization tasks within the project.
Conclusion
In conclusion, this pilot project has provided valuable insights into the functional connectivity patterns in individuals with Parkinson’s disease and neuropsychiatric symptoms (PD+NPS). The analysis of resting-state fMRI data has revealed distinct alterations in functional brain networks specific to the PD+NPS population. While these findings contribute to our understanding of the condition, further research using larger datasets is needed to fully elucidate the underlying neural mechanisms and to explore the potential implications for future research and clinical interventions.
Acknowledgements:
I would like to express my sincere gratitude to Prof. Bellec, and other co-founder and TAs in particular Isil and Marie-Eve who have contributed to the development of this project. I also acknowledge the support and assistance provided by the Niemolab (My Ph.D. supervisor Dr. Alexandru Hanganu) and his research team.