Resting State Functional network connectivity changes in reward network of adoloscents who are at risk for addiction.
By Subhasri Viswanathan
Published on May 16, 2020
May 16, 2020

Project definition
Background
Adolescence is characterized by significant brain developmental changes and I am interested in understanding the functional network connectivity changes from a developmental perspective and explore the influence of substance use on these developing brain networks.
Main questions to answer
How does resting state functional network connectivity change as a function of development
Objectives
To use nilearn to compute functional network connectivity measures Visualization tools - plotly To use Github for version control and data management
Tools
The following tools and libraries were used in this project
Github Nilearn Nibabel Plotly
Data
The data collected as a part of the Neuro Venture Trial where 155 adolescents were sub-sampled from the Co-Venture trial Conrod, 2016 for a structural and functional neuroimaging study at three-time points namely T1 ( baseline), T2 ( 24 months from baseline ) and T3( 48 months from baseline). The study followed exclusion criteria of any major neuro-developmental disorders (e.g., autism), uncorrectable visual impairment or hearing deficits, severe mental health problems (e.g., schizophrenia, bipolar disorder), uninterruptible central nervous system medication, and any magnetic resonance imaging (MRI) contraindications like pregnancy or braces Bourque et al., 2016. All the participants underwent structural and functional neuroimaging with two cognitive tasks namely the Stop Signal task and the Monetary Incentive Delay Task at all three-time points. Timeline follow-back interviews were conducted face-to-face at each time point to assess alcohol and drug use patterns over the last 6 months.
Deliverables
At the end of this project, we will have:
- A Jupyter notebook : The Jupyter notebook has cells explaining in detail the above mentioned steps with comments on each cell to navigate through this workflow
- Documentation as Git Repo markdown: This is the readme file which will be the overview of the project
Results
A sample of n = 20 was used for the sake of the project at Brain Hack School 2023. The preprocessed data at each time point namely baseline (Time point 1), Time point 2 and Time point 3 were used and the following steps were carried out
- Using nilearn’s NiftiMasker the data was first masked to remove any background and noisy voxels
- Further the data was thresholded and inverse transformed back to a nibabbel supported image for further computations
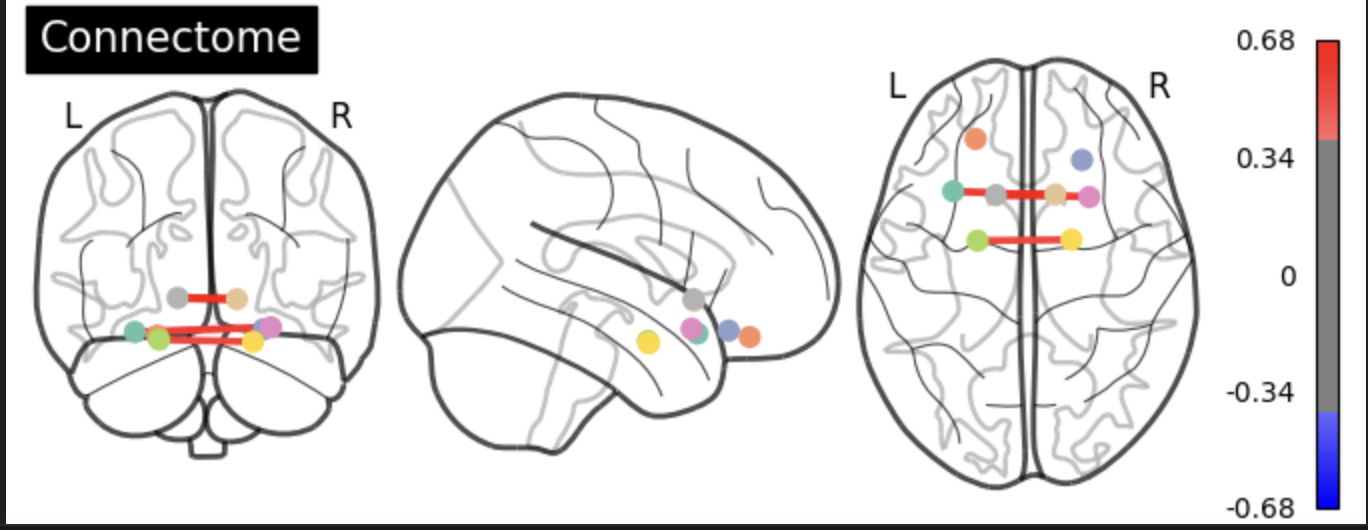
For understanding the resting- state functional network connectivity in reward networks, a winner take all based parcellation co-ordinate atlas called the Seitzman Atlaswas used. This atlas was choosen due to the fact that the Atlas included sub -cortical regions and an exsisting reward network definition. Thus with Atlas, it is easy for visualizing and computing functional network connectivity in reward network.
- Further the Niftisphere masker was used to create a mask based on the reward network ROI information. With only MNI coordinates available for each ROI, closest possible anatomical label was taken from Neurosynth
- The data was further fit in the custom mask based on the reward network
- Correlation coefficient for each participant was computed and average correlation coefficent for each time point was computed and ploted using libraries like nilearn and Plotly
To understand the differences in connectivity matrixes across three time points, co-sine similarity matrix was computed for time point 1 and 2, 1 and 3 and 2 and 3.
Graph theory visualizations was done using the networkx library where a graph network was plotted based on correlation matrix at each time point where each ROI was an edge and at 0.5 threshold, we can see that different ROI pairs emerge at different time points.
Interpretations
T-statsitics was computed for time point 1 and 2 (p = 0.20214417156708017), 1 and 3 (p = 0.7489632606673926) and 2 and 3 ( p = 0.3206681890020016). No statistical significance was seen in all the three time t-test scores showing that there is no significant reward network changes across time.
Tools I learned during this project
- Nilearn
- Nibabbel
- Plotly
- Networkx
Conclusion and acknowledgement
Thus, this repo will walk you through visualizing functional network connectivity based on a custom mask of ROIs of interest and visualize those network changes across time I would like to thank Brain Hack School 2023 team for their immense support and help.
References
- Seitzman, B. A., Gratton, C., Marek, S., Raut, R. V., Dosenbach, N. U. F., Schlaggar, B. L., Petersen, S. E., & Greene, D. J. (2020). A set of functionally-defined brain regions with improved representation of the subcortex and cerebellum. NeuroImage, 206, 116290. https://doi.org/10.1016/j.neuroimage.2019.116290
- Bourque, J., Baker, T. E., Dagher, A., Evans, A. C., Garavan, H., Leyton, M., Séguin, J. R., Pihl, R., & Conrod, P. J. (2016). Effects of delaying binge drinking on adolescent brain development: a longitudinal neuroimaging study. BMC psychiatry, 16(1), 445. https://doi.org/10.1186/s12888-016-1148-3


